Project:
CLAi
Date:
Nov 2024 - Jan 2025
CLAi is a product conceived by a veteran of call center business spanning several industries and tackling the entire spectrum of tasks required: customer support and consultancy, cold sales, upselling, customer retention, complaint filing etc. The base idea was to utilize AI to expand into customer bases and audiences that is too costly to reach using human labor.
The Core Functionality
Even at the time when AI evolution and adoption was at the very early stage (late 2023), one conclusion was clear back then and is held true to this day: the output of AI work is not deterministic — the same input will never guarantee the same output. So the owner along with the CTO he partnered with, come to the same conclusion the other players that eventually emerged into this market around the same time came to: the task AI performs is better to be segmented into step-by-step workflows to minimize the drift bare AI often demonstrates. And another realization came along — the step-by-step segmentation of the task that is given to AI mirrors a typical customer interaction or sales scripts the call center employees use all the time.
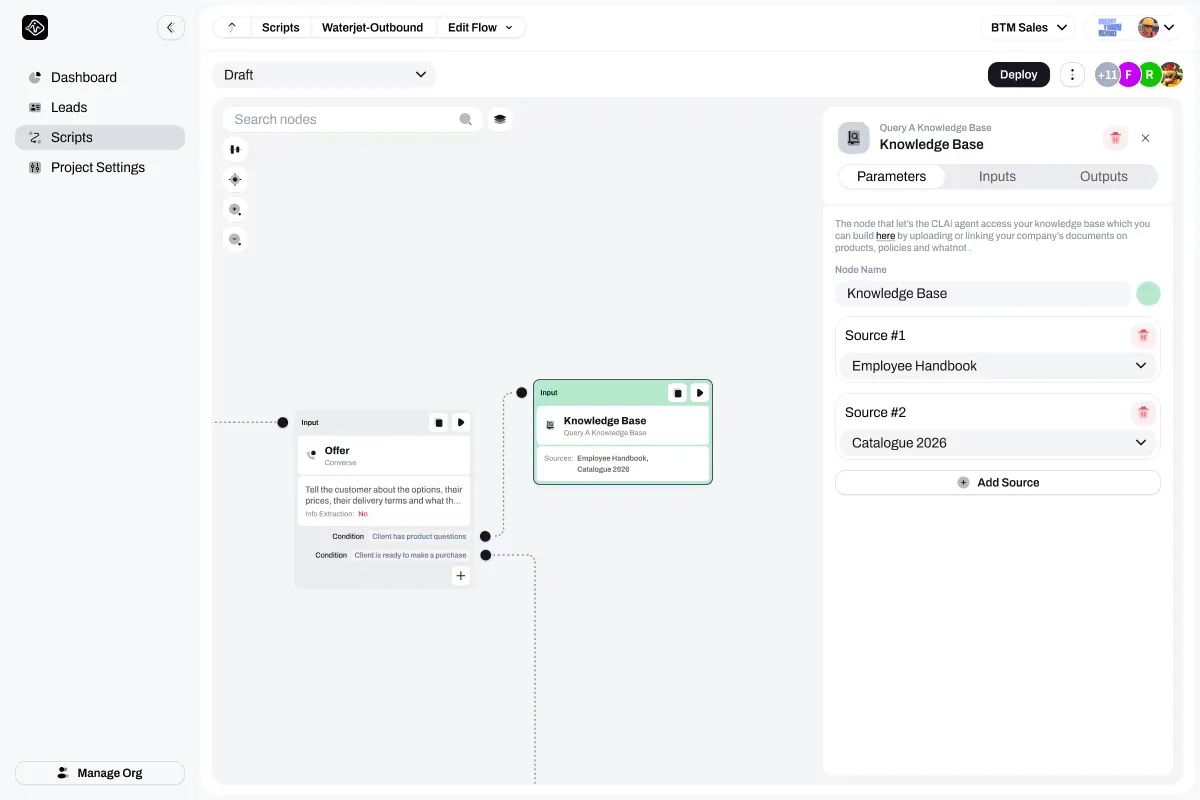
At the core CLAi gives their clients a tool that allows them to map the scripts, which are oftentimes just .docx files, using a no-code, drag-n-drop flowchart-like graphical interface, where blocks work out-of-the box with the default parameters, and the tweaking boils down to writing prompts. The core interface looks like this.
The Problem
The AI advantage is a double edge sword: it allows scaling up the operations normally done by humans by order of magnitude, in some cases, but that means the amount of work needed to ensure quality also scales up dramatically. And although the product included the ability to test the script manually before deploying, along with a log of all the interactions the AI executing this script had with the clients. All of this gave our customers the tools to monitor the outcomes of the script runs, but how would they know where to look for the root causes of the failures?
We needed a solution that would answer these key questions:
- How would our customers know where does their script is failing?
- How would they know why it is failing?
- How early would they know something went wrong?
Enablers And Hurdles
At that moment, the product already had several logic components implemented, that:
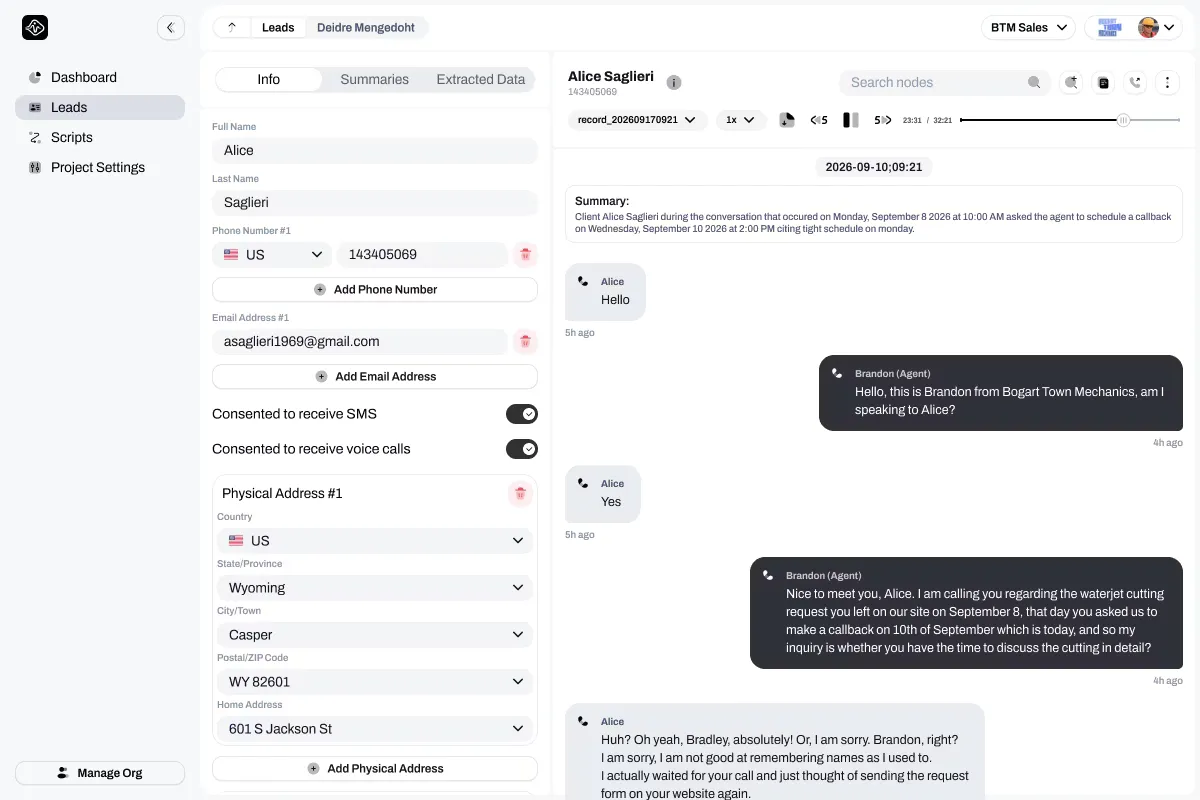
- Rendered a unified transcript from text messages and voice calls alike;
- For voice calls — used a separate voice recognition model that distinguished the AI agent, client and a third party (client’s relatives, human employees etc.);
- Consolidated each piece of the transcript, with the time stamp, into a JSON object alongside with the instance ID of the node that processed this part of the conversation and put it inside the JSON body object;
- Placed metadata such as: ID of the script that was running the conversation, it’s version, start timestamp into the header object of the JSON;
- Rendered a UI in form of a chat window (see the image below);
So the data points that could be used to cue in to specific moments of the conversations was already there.
The Definitions Of Success And Failure
The majority of the conversations with the customers that CLAi is designed first and foremost to handle, require some kind of action from the customer, a commitment. It could be a purchase, and in this case, due to legal constraints, it should be authorized by a human. It could be giving consent to receiving an email. Could be consenting to a visit from an employee (for example — free measurement before installing solar panels). So CLAi had several nodes that handled any kind of commitment from the user all have a flag in their settings which would allow the conversation to be marked as “success” or “failure” if they were activated or weren’t activated during the conversation.
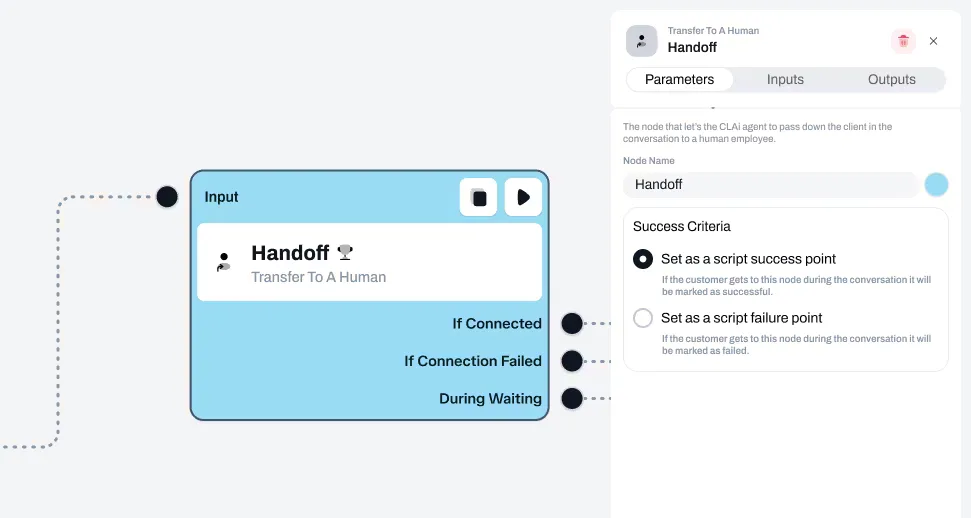
Basically there was a functionality in place that allowed the customers to see the bigger picture: which of their script did perform, and which fell flat. That on its own was a basis to build up the functionality for granular monitoring that would reveal the underlying reasons of failures, so our customers could quickly fix, reiterate and perfect their scripts.
UI Paradigm Of Choice
The gold standard UI paradigm for a throughput monitoring are the funnel charts, because how easy they are to read. However, I decided to discard that idea because funnel charts are initially built with a single path in mind. Given that the scripts would 99% of the time have a branching, tree-like structure and failures could have vastly different nature, adapting funnel charts would pose a challenge.
The answer to the question of adapting funnel charts to branching flows are Sankey diagrams. However, I also discarded this idea on the following premises:
- The complexity of a typical sales script (see below) is still exceeding the capacity of the Sankey diagram to display it while maintaining the high readability;
- A separate complex diagram is adding a level of abstraction that a cognitive friction when trying to match the script as it is seen in the canvas with the diagram;
- The script UI is technically already a diagram;
A Trifold Solution
So, the solution should be based on the node editor that is used to construct scripts, but it should not overwhelm the user with the details that are irrelevant for building, and since the users most likely are already familiar with an interaction paradigm such as “modes” (Edit Mode and Preview mode in Google Slides or Normal View or Page Break Preview modes in Microsoft Excel) then the script should have a special monitoring mode.
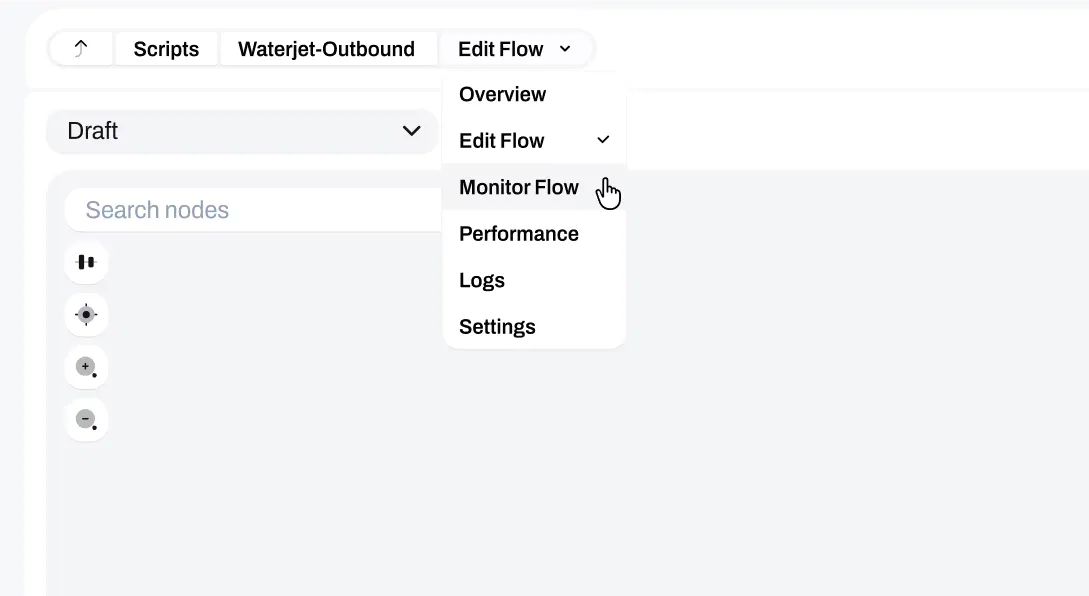
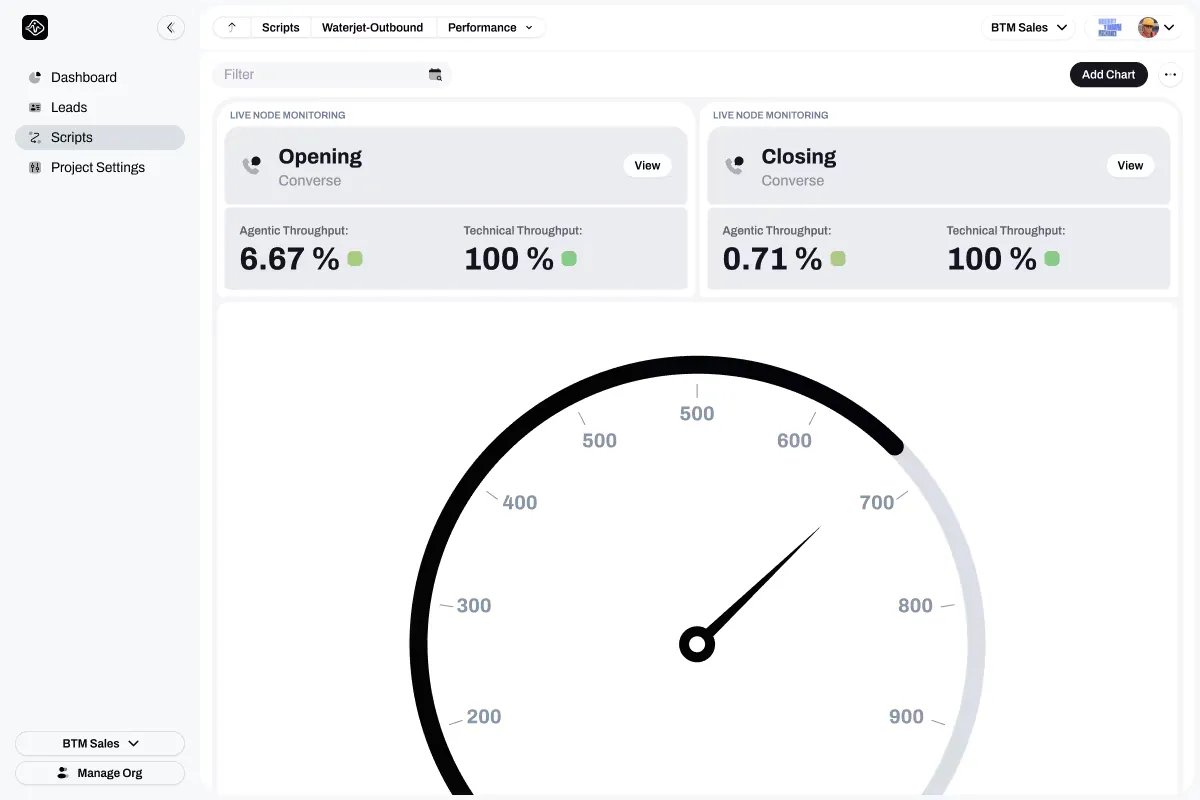
Addressing the “where”, the metric. The most obvious solution is to display the percentage of the conversations that went through a given node (or, those that didn’t go through). Explicitly revealing the bottlenecks.
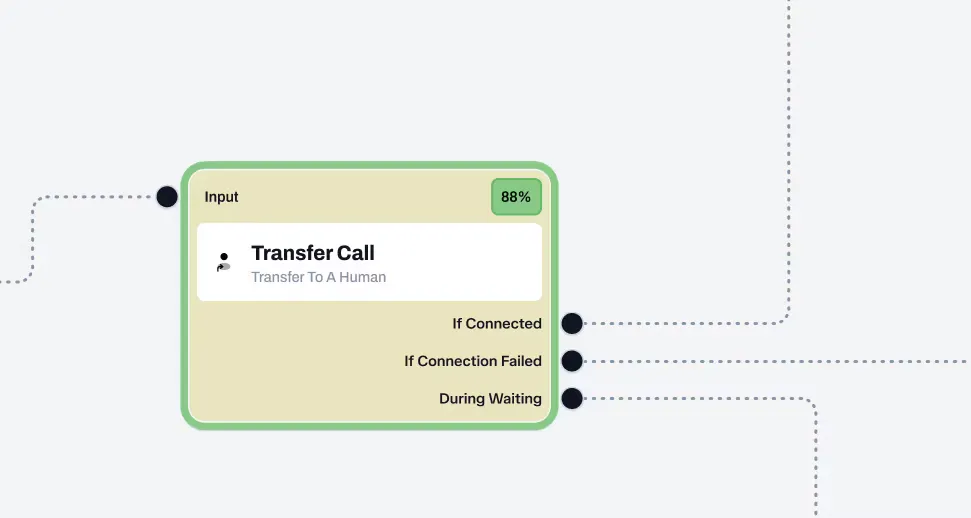
Addressing the “where”, the observability. Since the scripts would often be quite large, too large to spot the number from a zoomed out “bird’s eye” view, my solution was to semantically color-code the nodes based on the metric.
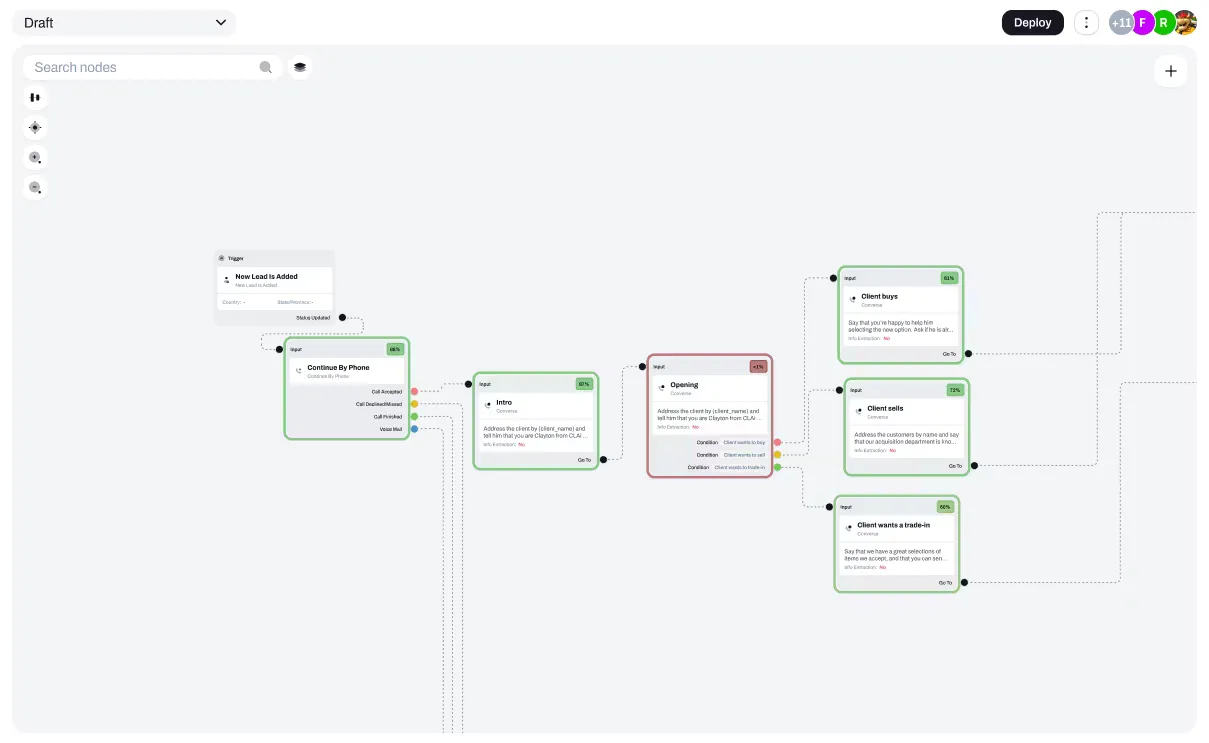
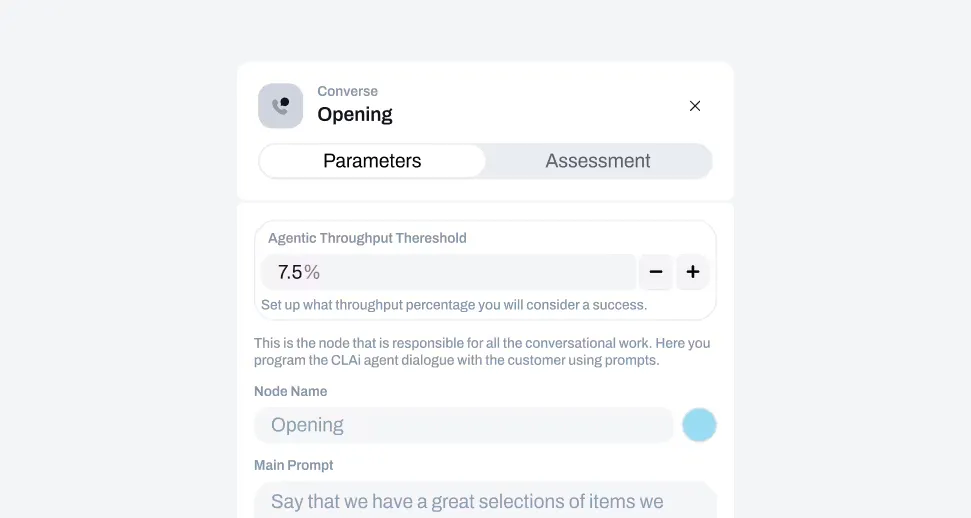
However, since the nature of the failures in the nodes is two-fold: they can be either of technical — when the infrastructure or logical nodes fail, or some parts of them fail; or agentic — when the AI model fails due to either an incorrect/poorly designed prompt, or incorrect values for model parameters (Temperature, Top-P, Top-K etc) and the model says or writes something inappropriate, or the customers just aren’t interested and dropping off, and, while the former is always following “less than 100% is bad” operand, the latter is more akin to a conversion rate funnels where otherwise miniscule percentages (around 2%) could be intentionally targeted, the sensible solution was to let the users decide the target throughput threshold themselves.
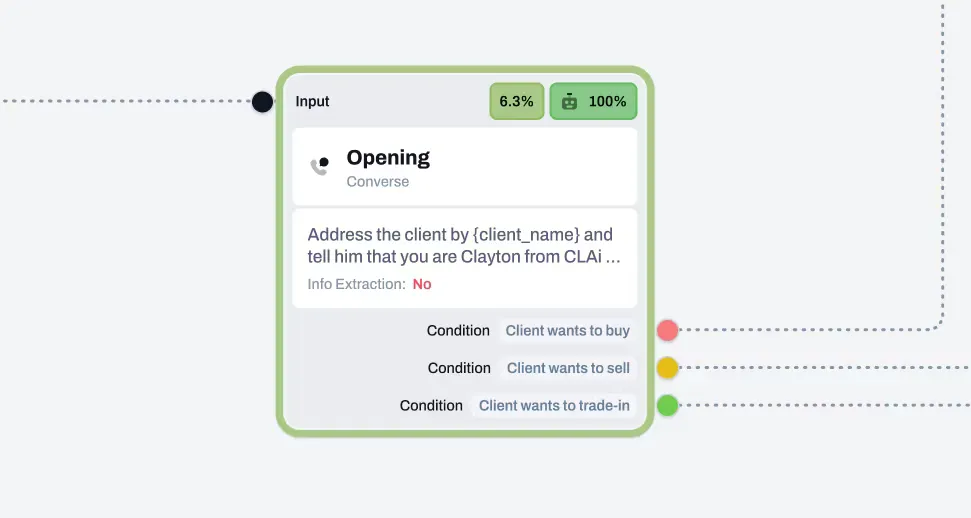
Another caveat: the conversational nodes do also have a logic under the hood. They are all either sending the requests to the inference engines that run the model, and can fail, or, which is even more common, sending requests via API to the model providers (Antrhopic, OpenAI, Google, OpenRouter etc.), which also have multiple points of failure. And there absolutely could be cases where 31% of requests to the inference engine fail giving us a technical throughput of 69%, and then, from those requests that have successfully processed the agentic throughput is around 1.5%, and it is crucial for our customers to be aware of both problems if they appear, the solution is a value breakdown.
Addressing the “why”. The agentic side. Opening up a problematic conversational node we can run the diagnostics by pressing the dedicated button, which selects a sliver of conversations that hadn’t passed through the node in question, greps their JSONs for the unique node instance ID and sends the pieces of transcript that are related to this node to a separate LLM for analysis and based on RAG materials writes an assessment of what possible went wrong from the agent’s side, provides the links to the conversations for the users to double-check, as well as assesses the prompt and proposes the improved version, with the ability to transfer these proposed changes to the draft version of the script.
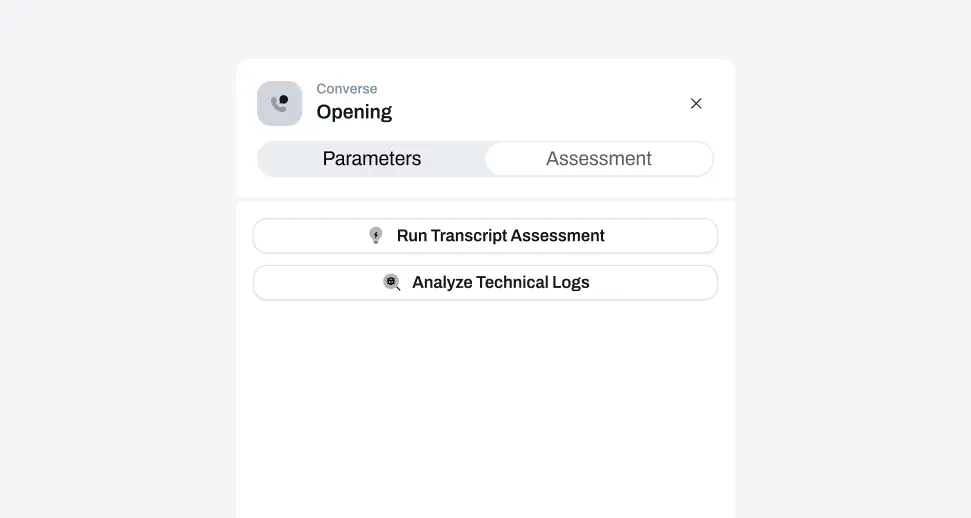
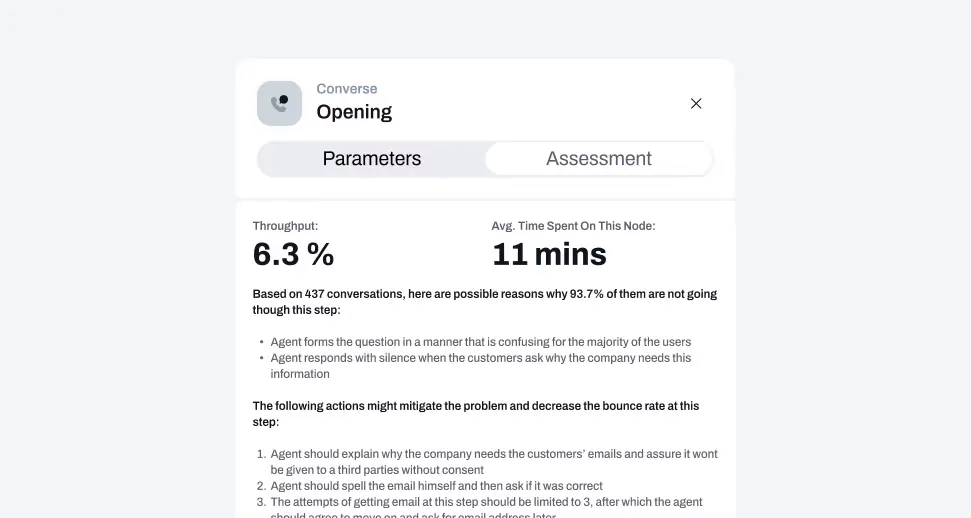
Addressing the “why”. The technical side. Switching to the other tab users could click on a dedicated button to run the diagnostics, which also runs a separate LLM but this time it analyzes and explains the error logs, with ability to render a markdown with a report and save it to the user’s device.
Addressing the “how early”. To always keep an eye on the performance of the selected script the users could set up the alert messages via Slack or email, send the throughput/dropoff numbers to the dashboard as widgets.
The Prioritization
As in any startup environment, the main operand is “move fast”. The whole package provided not only the means to revealing the bottlenecks and identifying the root causes, there were a silver of quality-of-life details, that in a B2B SaaS more often than not are not a part of decisive factor in the purchase decision. What went in immediately:
- The throughput metrics;
- The color-coding;
- The AI-powered assessment;
- The examples from the conversations;
- Sending a throughput value from a node to a dashboard.
What was cut from the initial release and postponed:
- The “apply fixes” functionality;
- Slack and email alerts;
- RAG customization for AI-powered transcript and prompt assessment;
Conclusions
Thus we developed a competitive advantage for CLAi that around 20 competitors I looked at, didn’t have at the moment, and some probably don’t have to this day.